Imaggeo Logo
  • Browse
  • Regions
  • Map
  • Tags
  • Colours
  • Upload
EGU Logo (opens in a new window)
The geosciences image and video repository
of the European Geosciences Union (opens in a new window)
Log in
  • Browse
  • Regions
  • Map
  • Tags
  • Colours
  • Upload
  • About
  • FAQ
  • Imprint
  • Privacy notice
  • Photo competition
  • Log in
  • Theme

Follow EGU on:

  1. Home
  2. Tags
  3. Graphic

Graphic

11 items
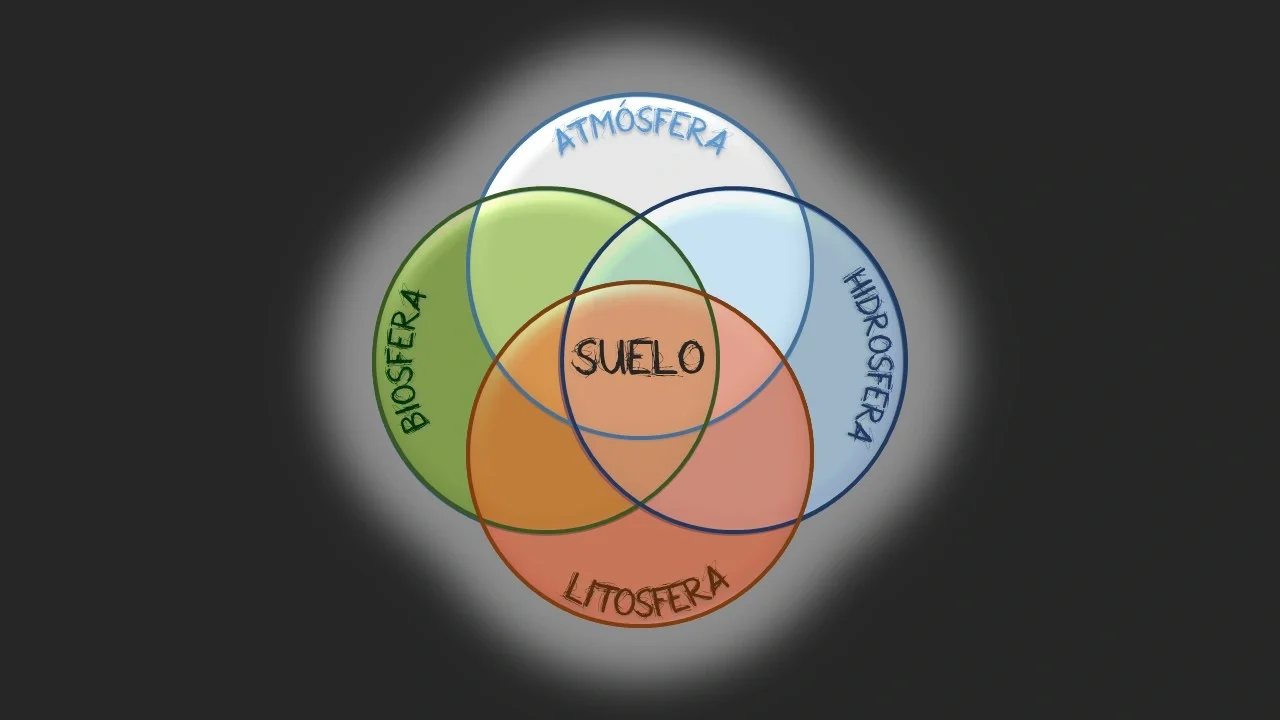
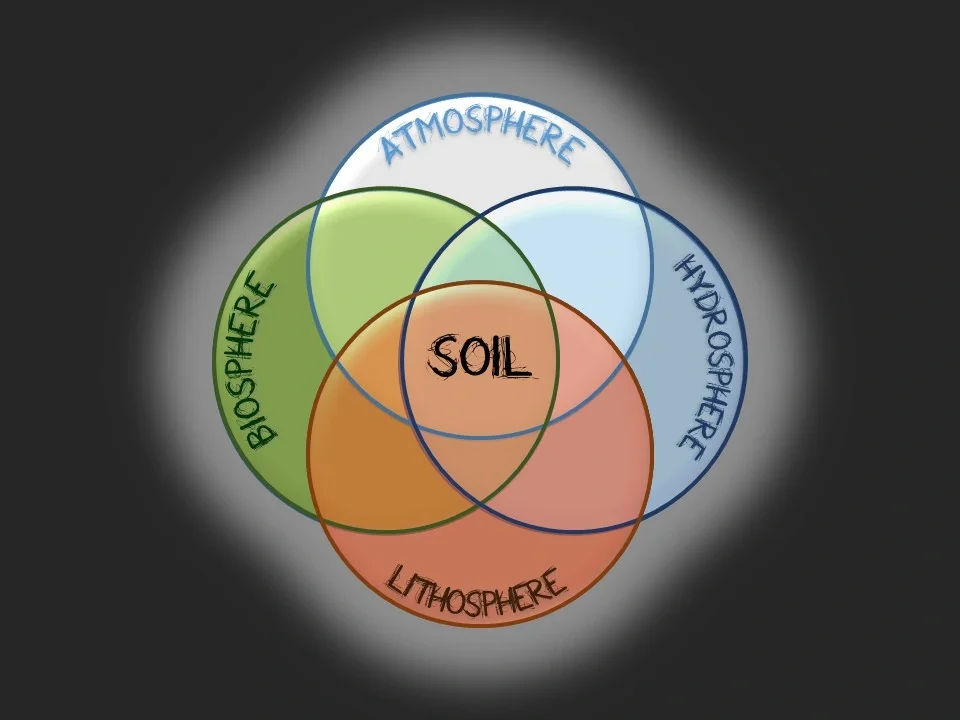
Diagram of four overlapping coloured circles labelled Atmósfera, Hidrosfera, Litosfera and Biosfera, with the word Suelo in the area where all four overlap.
El suelo en la interfase Antonio Jordán
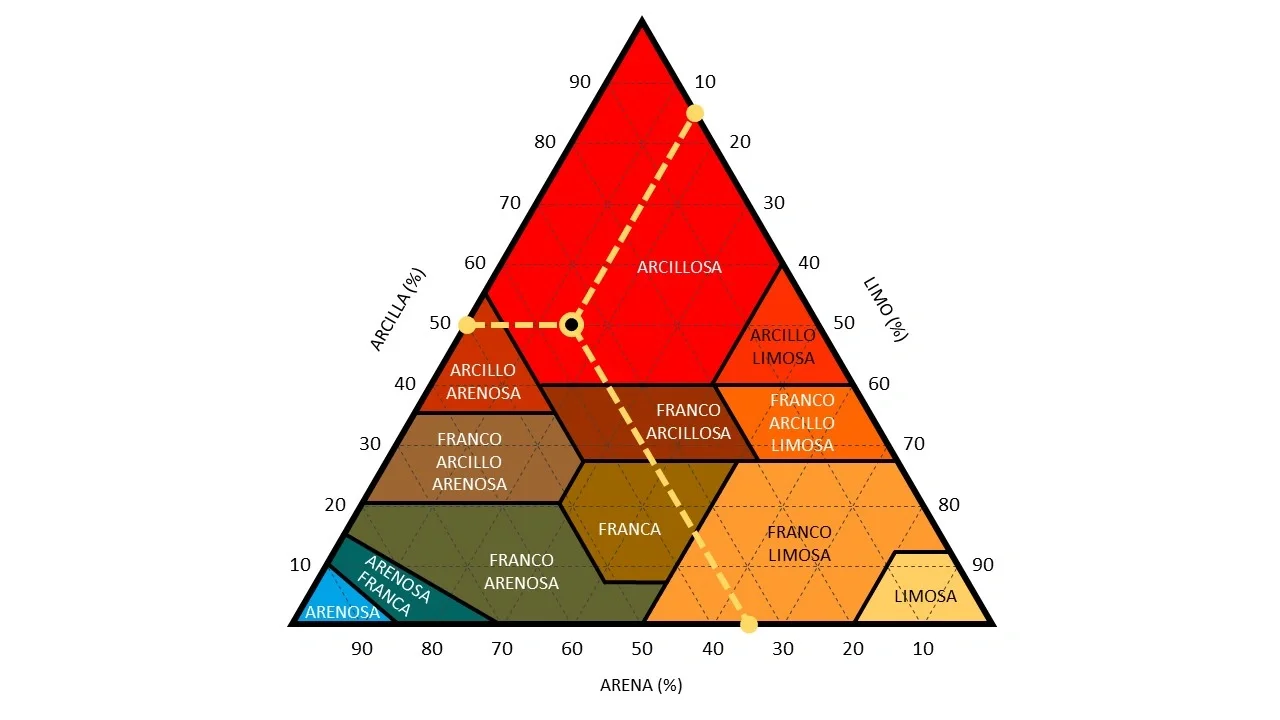
Diagram of a soil texture triangle in Spanish, coloured fields for clay, silt and sand classes, with yellow dashed lines showing how to read off a sample at 50 percent clay.
Soil texture triangle (in Spanish) Antonio Jordán
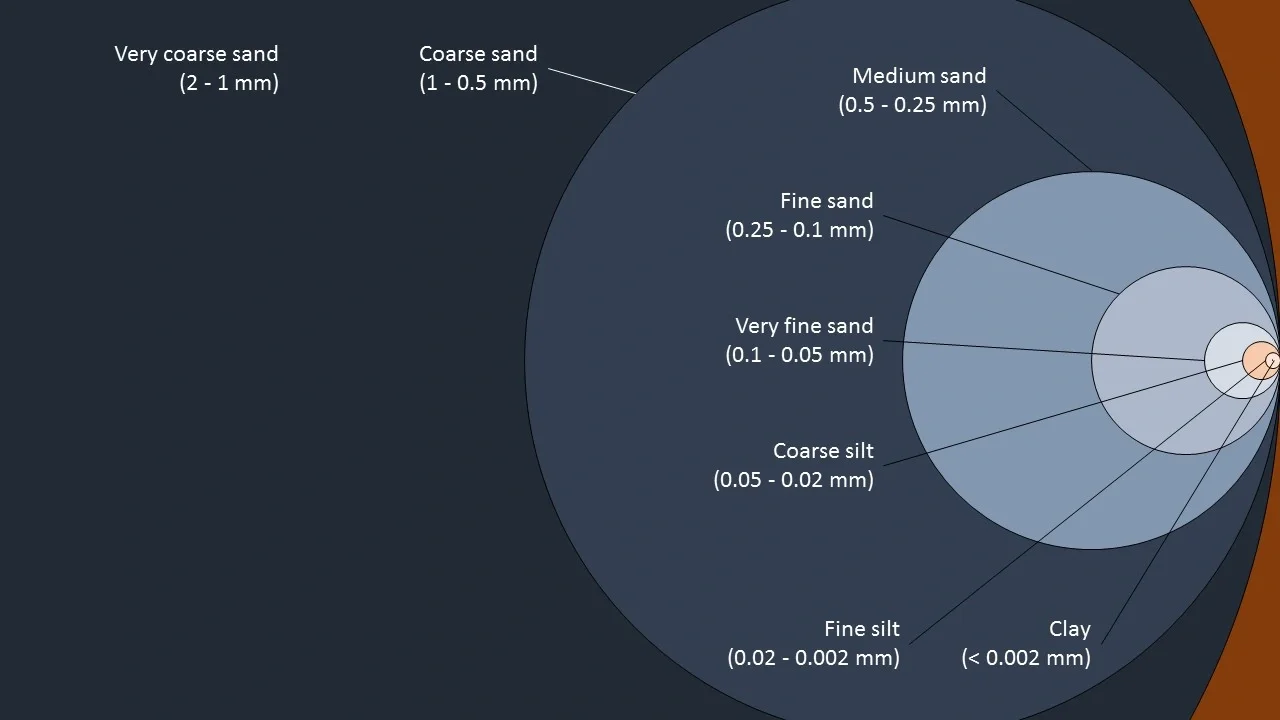
Diagram of nested circles comparing soil particle size classes, from very coarse sand at 2 to 1 mm down through sands and silts to clay at less than 0.002 mm, each class a smaller circle.
Classification of soil mineral particles by size Antonio Jordán
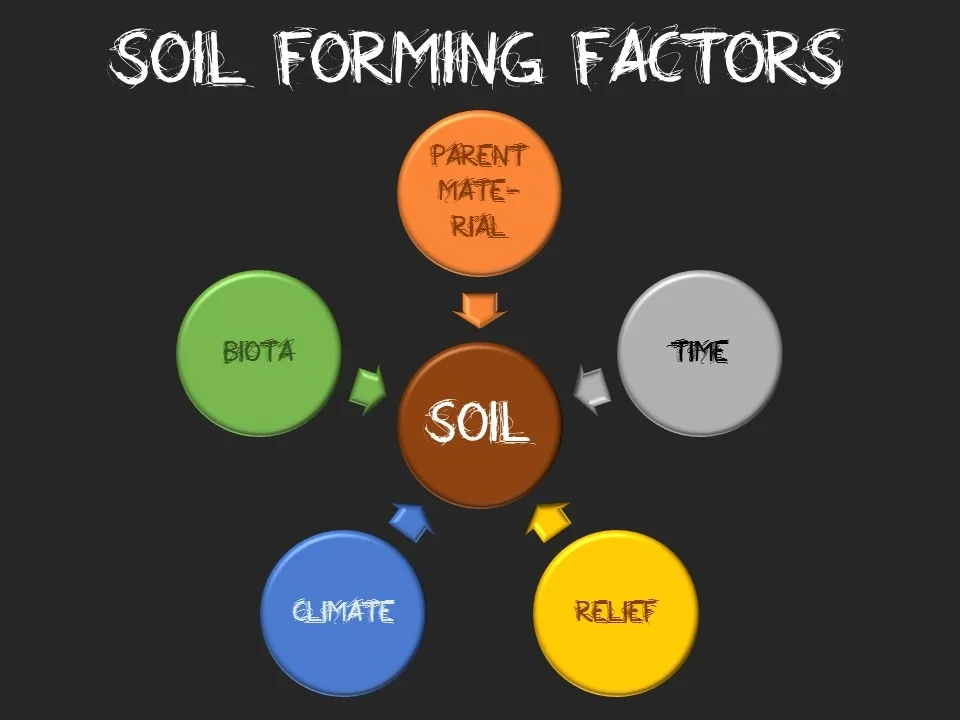
Diagram titled Soil Forming Factors: a brown circle labelled Soil in the centre, with arrows pointing to it from five coloured circles labelled Parent material, Time, Relief, Climate and Biota.
Soil forming factors Antonio Jordán
Venn diagram of four overlapping circles labelled Atmosphere, Hydrosphere, Lithosphere and Biosphere, with Soil written where all four overlap in the centre.
Soil in the interface Antonio Jordán
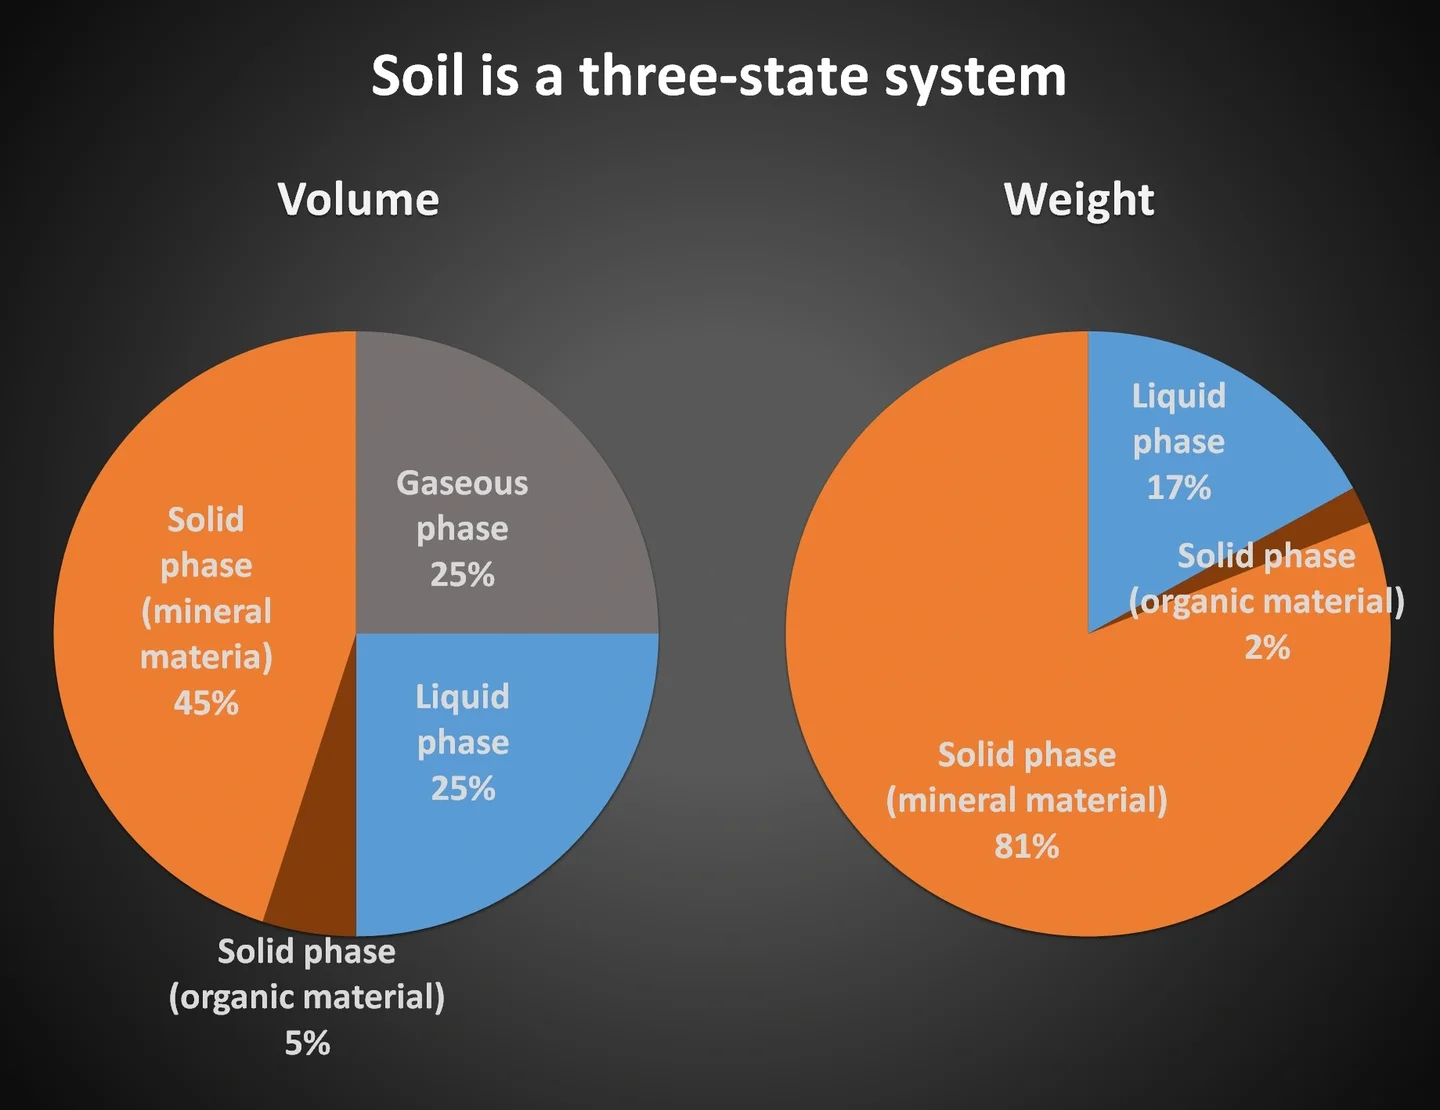
Chart of two pie charts titled Soil is a three-state system: by volume soil is 45% mineral, 5% organic, 25% liquid and 25% gas; by weight 81% mineral, 2% organic and 17% liquid.
Soil is a 3-state system Antonio Jordán
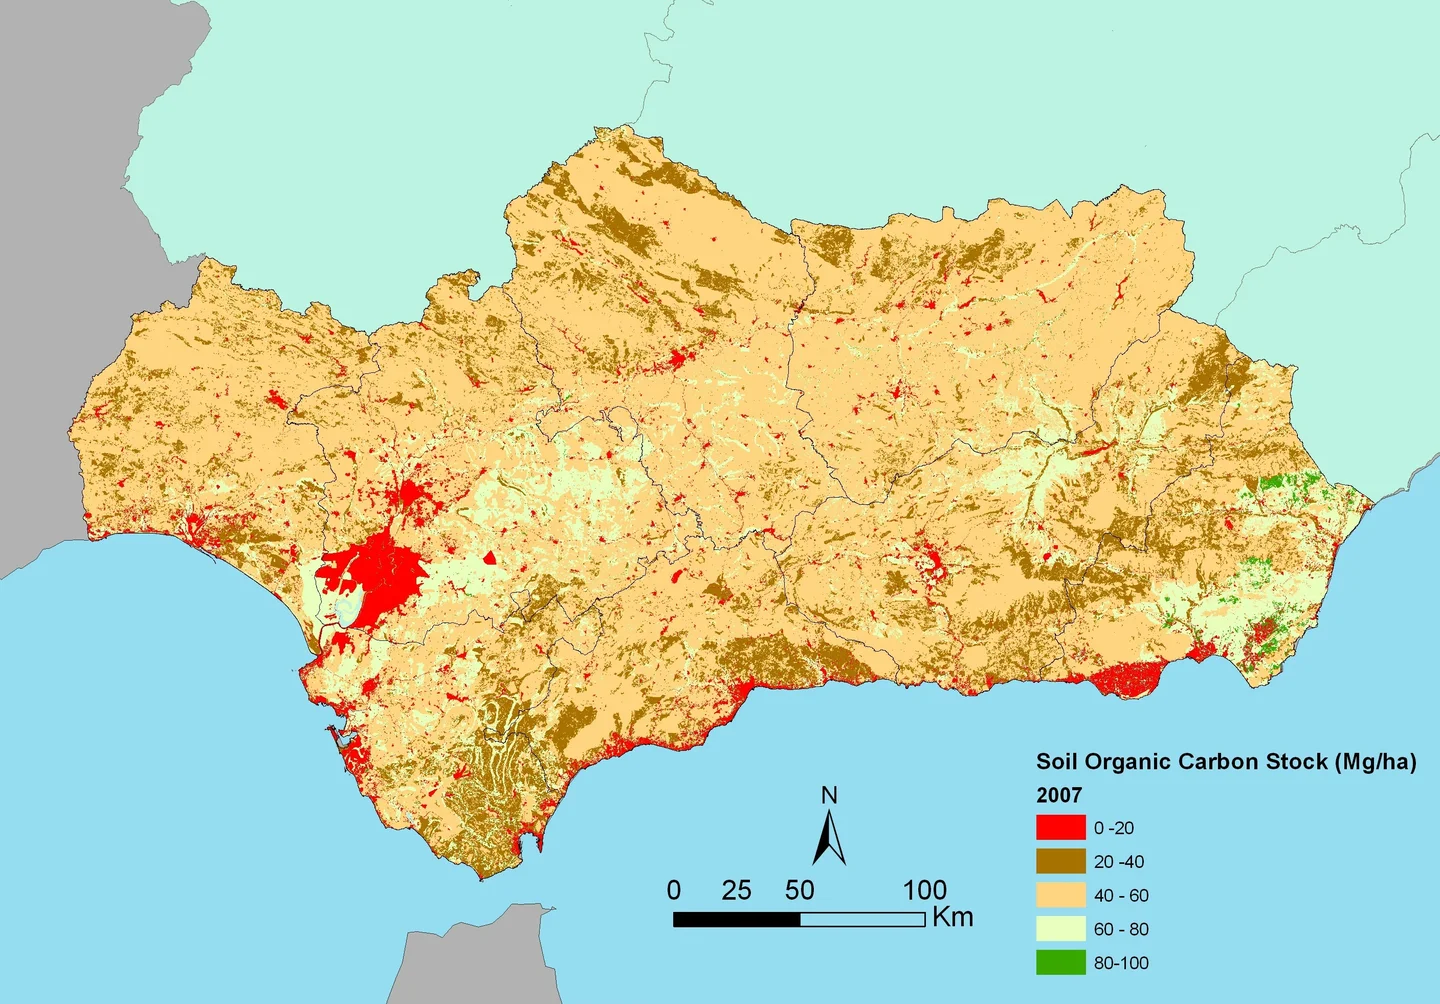
Map of soil organic carbon stock in a southern region, mostly beige for 40 to 60 megagrams per hectare, with brown patches lower, red urban and coastal spots lowest, few green high values.
Map of soil organic carbon content (0–75 cm) in Andalusia (southern Spain) Antonio Jordán
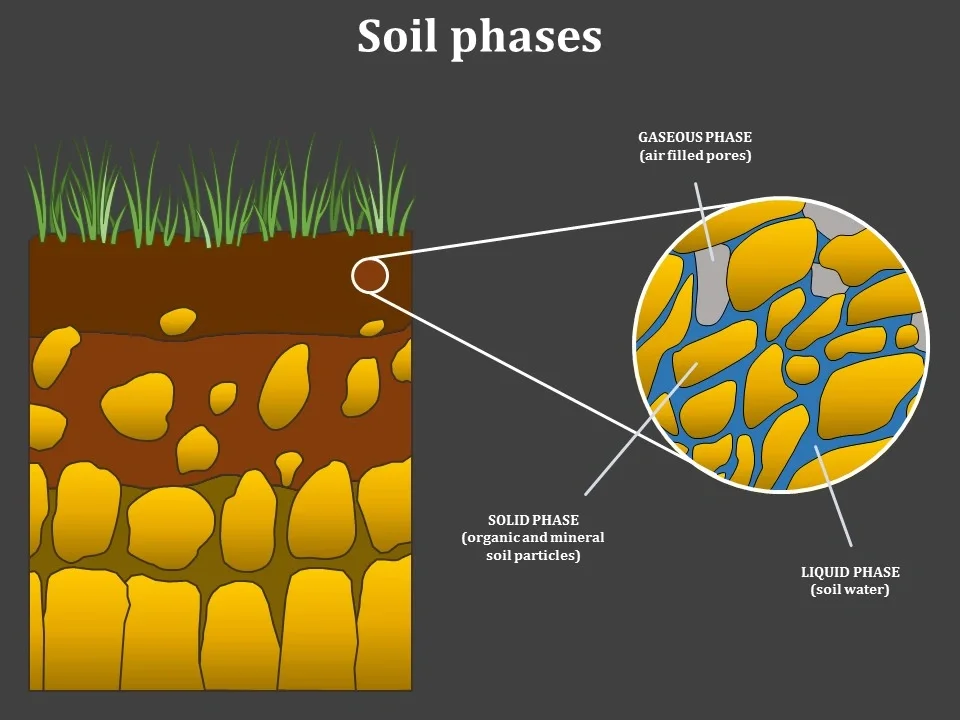
Diagram of soil phases: a drawn soil profile under grass with a magnified circle showing yellow solid particles, blue soil water and grey air-filled pores between them.
Soil phases Antonio Jordán
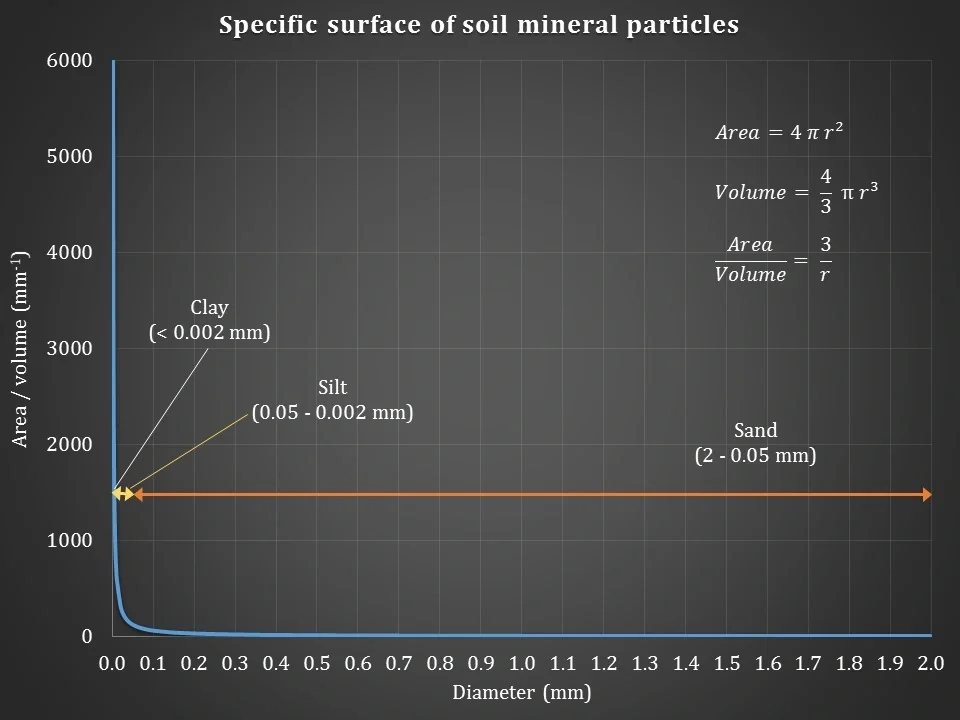
Chart of area to volume ratio against particle diameter: a curve plunging from very high values for clay and silt to near zero across the sand range, with the sphere formulas.
Specific surface of soil mineral particles Antonio Jordán
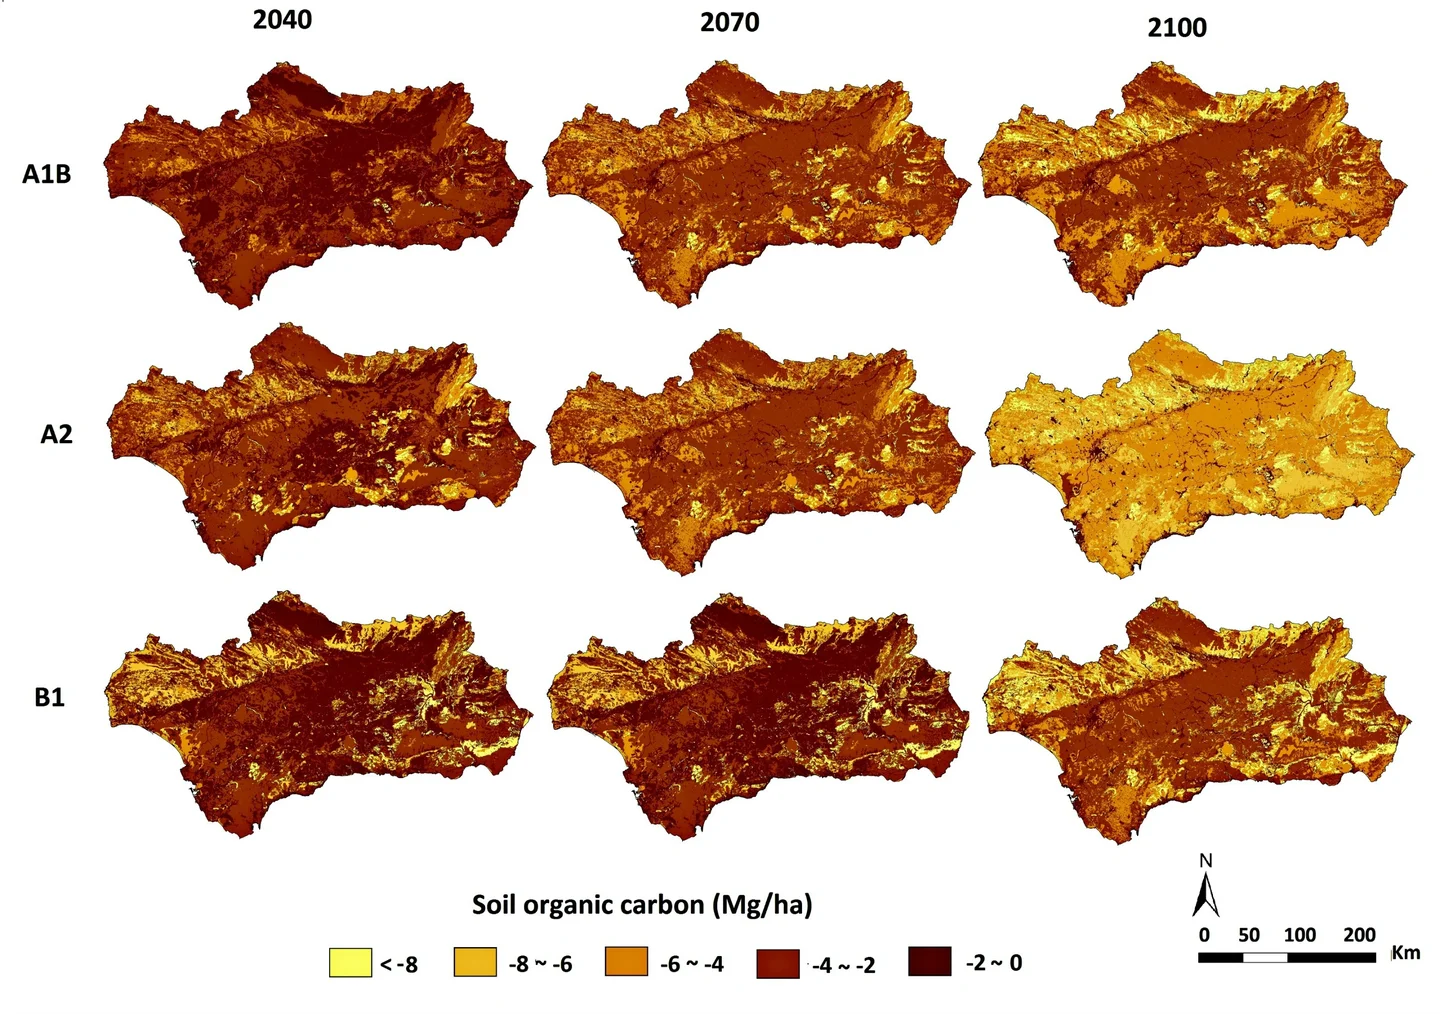
Grid of nine maps of one region for three climate scenarios and three future years, coloured yellow to dark brown by soil organic carbon loss, with the lightest, greatest losses in the last A2 map.
Spatial changes in the distribution of organic C in Andalusia under different climate change scenarios Antonio Jordán
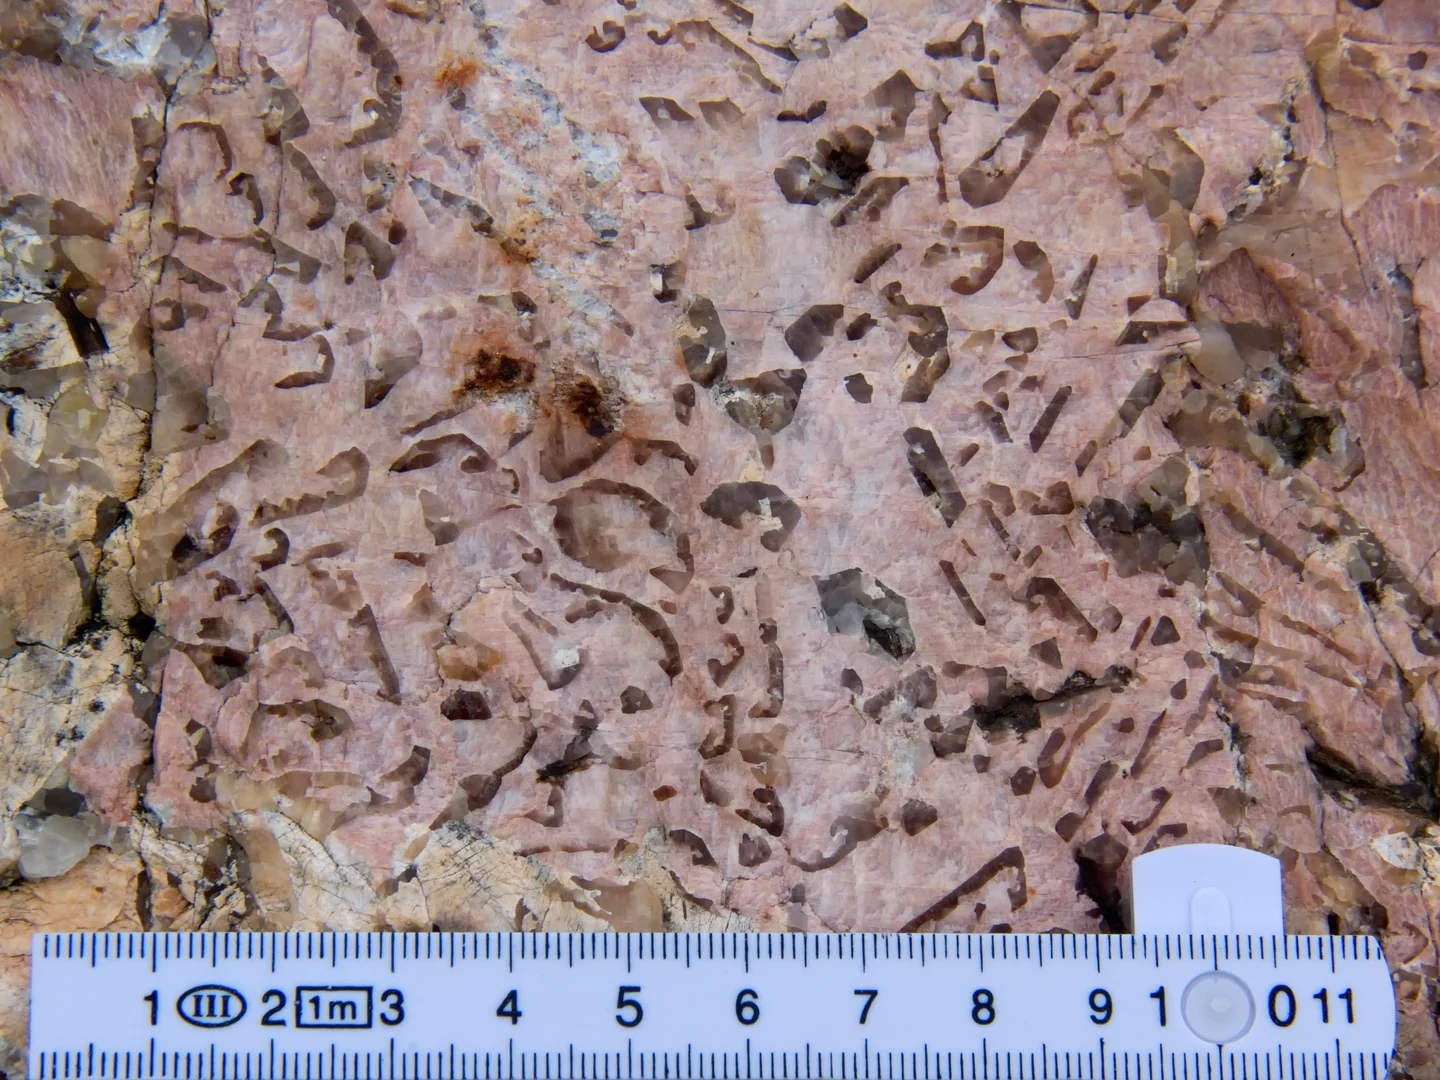
Close-up of a pink granite surface with many small grey angular and hooked quartz shapes resembling script, above a folding ruler showing about 11 cm.
Runic pegmatite boulder Gunnar Ries

Nothing to show here yet.

No results match the current search, filter or sort.

  • About
  • FAQ
  • Imprint
  • Privacy notice
  • Photo competition
  • |
  • Follow EGU on:
  • LinkedIn
  • Instagram
  • YouTube
  • Facebook
  • Mastodon
  • Bluesky
  • EGU blogs